1.3.4. Domains & Color
Example files that accompany this section: http://grasshopperprimer.com/appendix/A-2/1_gh-files.html
The color wheel is a model for organizing colors based on their hue. In Grasshopper, colors can be defined by their hue value in a range of 0.0 to 1.0. Domains are used to define a range of all possible values between a set of numbers between a lower limit(A) and an upper limit (B).

In the color wheel, hue corresponds to the angle. Grasshopper has taken this 0-360 domainand remapped it between zero and one.
By dividing the Hue domain (0.0 to 1.0) by the number of segments desired, we can assign a hue value to each segment to create a color wheel.
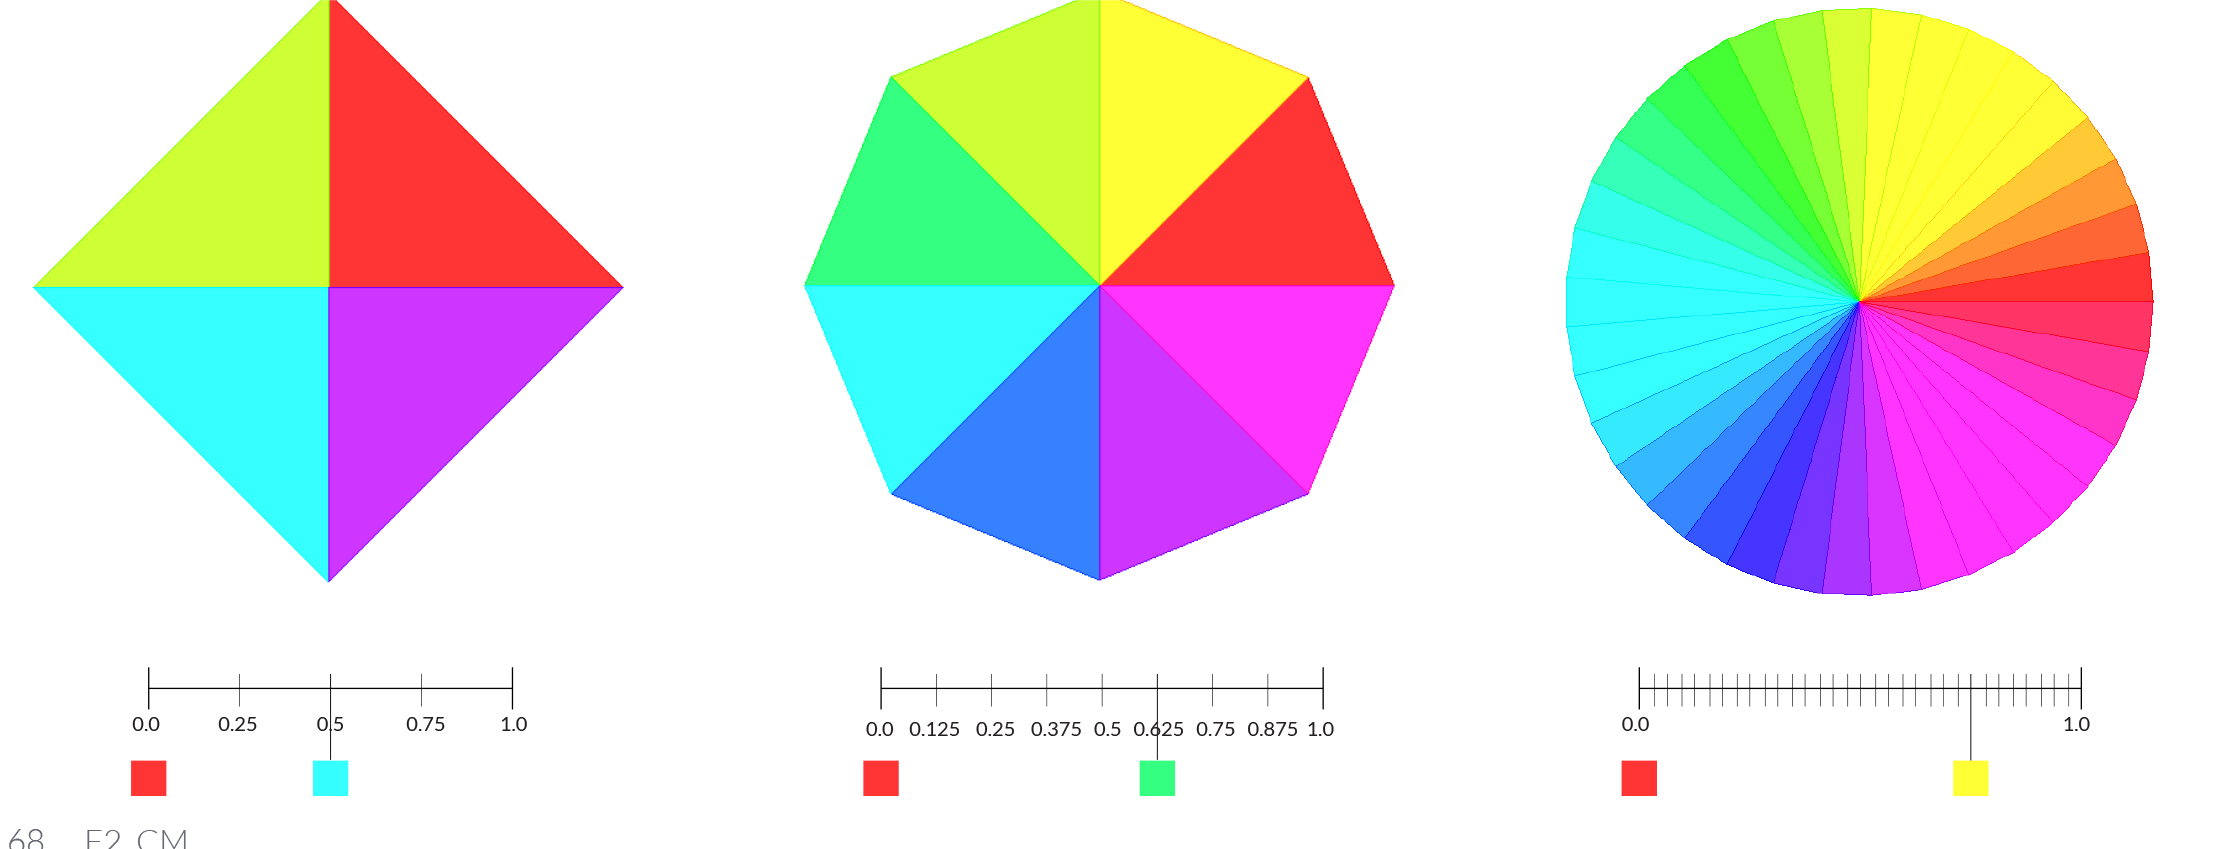
In this example, we will use Grasshopper’s domain and color components to create a color wheel with a variable amount of segments.
| 01. | Type Ctrl+N (in Grasshopper) to start a new definition | |
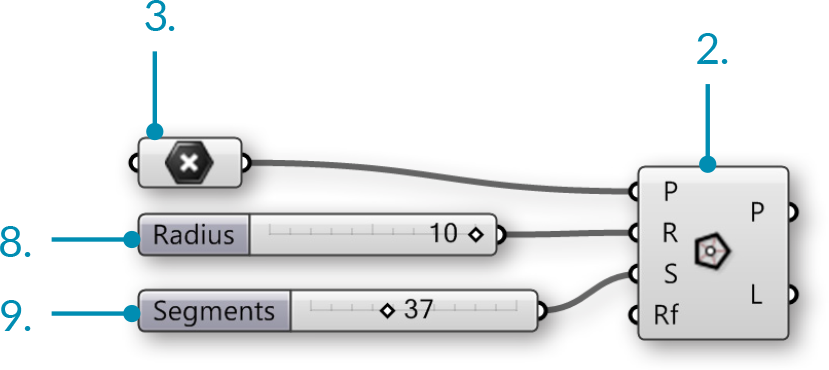
| 02. | Curve/Primitive/Polygon – Drag and drop a Polygon component onto the canvas |  |
| 03. | Params/Geometry/Point – Drag and drop a Point Parameter onto the canvas |  |
| 04. | Right-Click on the Point Component and select set one point | |
| 05. | Set a point in the model space. | |
| 06. | Connect the Point Parameter (Base Point) to the Plane (P) input of the Polygon component | |
| 07. | Params/Input/Number Sliders – Drag and drop two Number Sliders onto the canvas | |
| 08. | Double-click on the first Number Sliders and set the following:
Lower Limit: 0 Upper Limit: 10 Value: 10 |
|
| 09. | Double-click on the second Number Sliders and set the following:
Lower Limit: 0 Upper Limit: 100 Value: 37 |
|
| 10. | Connect the Number Slider (Radius) to the Radius (R) input of the Polygon component When you connect a number slider to a component in will automatically change its name to the name of input that it is connecting to. |
|
| 11. | Connect the Number Slider (Segments) to the Segments (S) input of the Polygon component |
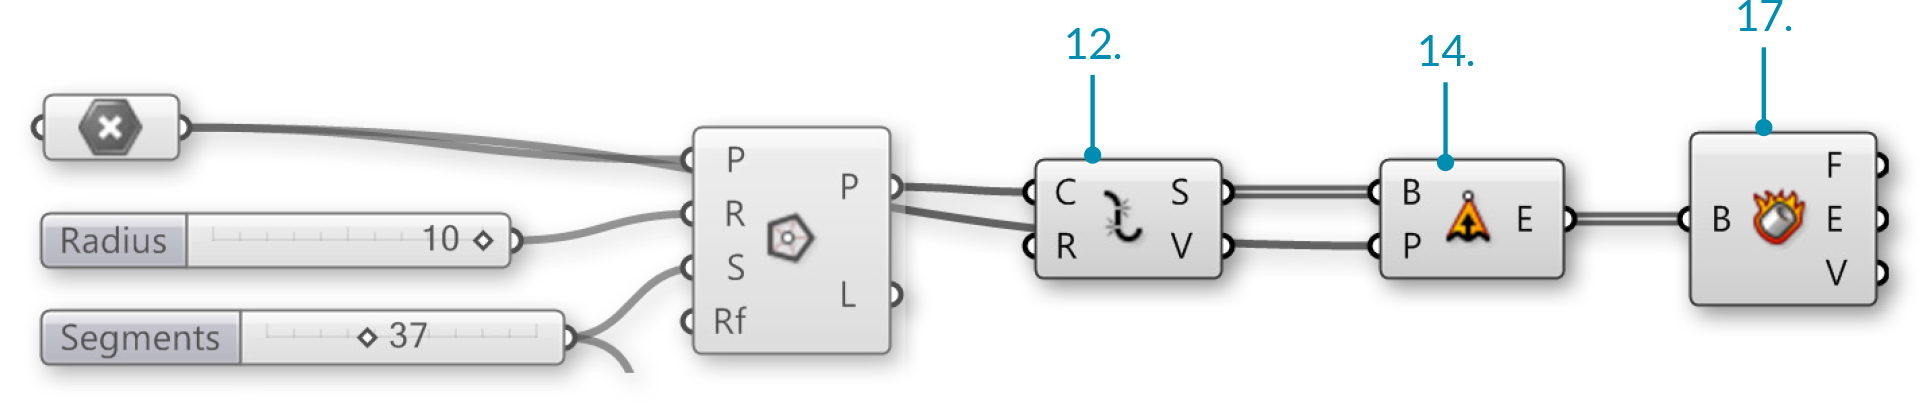
| 12. | Curve/Util/Explode – Drag and drop an Explode component onto the canvas. |  |
| 13. | Connect the Polygon (P) output of the Polygon component to the Curve (C) input of the Explode component | |
| 14. | Surface/Freeform/Extrude Point – Drag and drop the Extrude Point component onto the canvas |  |
| 15. | Connect the Segments (S) output of the Explode component to the Base (B) input of the Extrude Point | |
| 16. | Connect the Point Parameter (Base Point) to the Extrusion Tip (P) of the Extrude Point component | |
| 17. | Surface/Analysis/Deconstruct Brep – Drag and drop the Deconstruct Brep component on to the canvas |  |
| 18. | Connect the Extrusion (E) output of the Extrude Point component to the Deconstruct Brep (B) component |
| 19. | Maths/Domain/Divide Domain – Drag and drop the Divide Domain componentThe Base Domain (I) is automatically set between 0.0-1.0 which is what we need for this exercise |
 |
| 20. | Connect the Number Slider (Segments) to the Count (C) input of the Divide Domain component | |
| 21. | Math/Domain/Deconstruct Domain – Drag and drop the Deconstruct Domain component |  |
| 22. | Connect the Segments (S) output of the Divide Domain component to the Domain (I) input of the Deconstruct Domain component | |
| 23. | Display/Colour/Colour HSL – Drag and drop the Colour HSL component |  |
| 24. | Connect the Start (S) output of the Deconstruct Domain component to the Hue (H) input of the Colour HSL components | |
| 25. | Display/Preview/Custom Preview – Drag and drop the Custom Preview component |  |
| 26. | Right click on the Geometry (G) input of the Custom Preview component and select FlattenSee 1-4 Designing with Data Trees for details about flattening |
|
| 27. | Connect the Faces (F) output of the Deconstruct Brep component to the Geometry (G) input of the Custom Preview component | |
| 28. | Connect the Colour (C) output of the Colour HSL component to the Shade (S) input of the Custom Preview component |
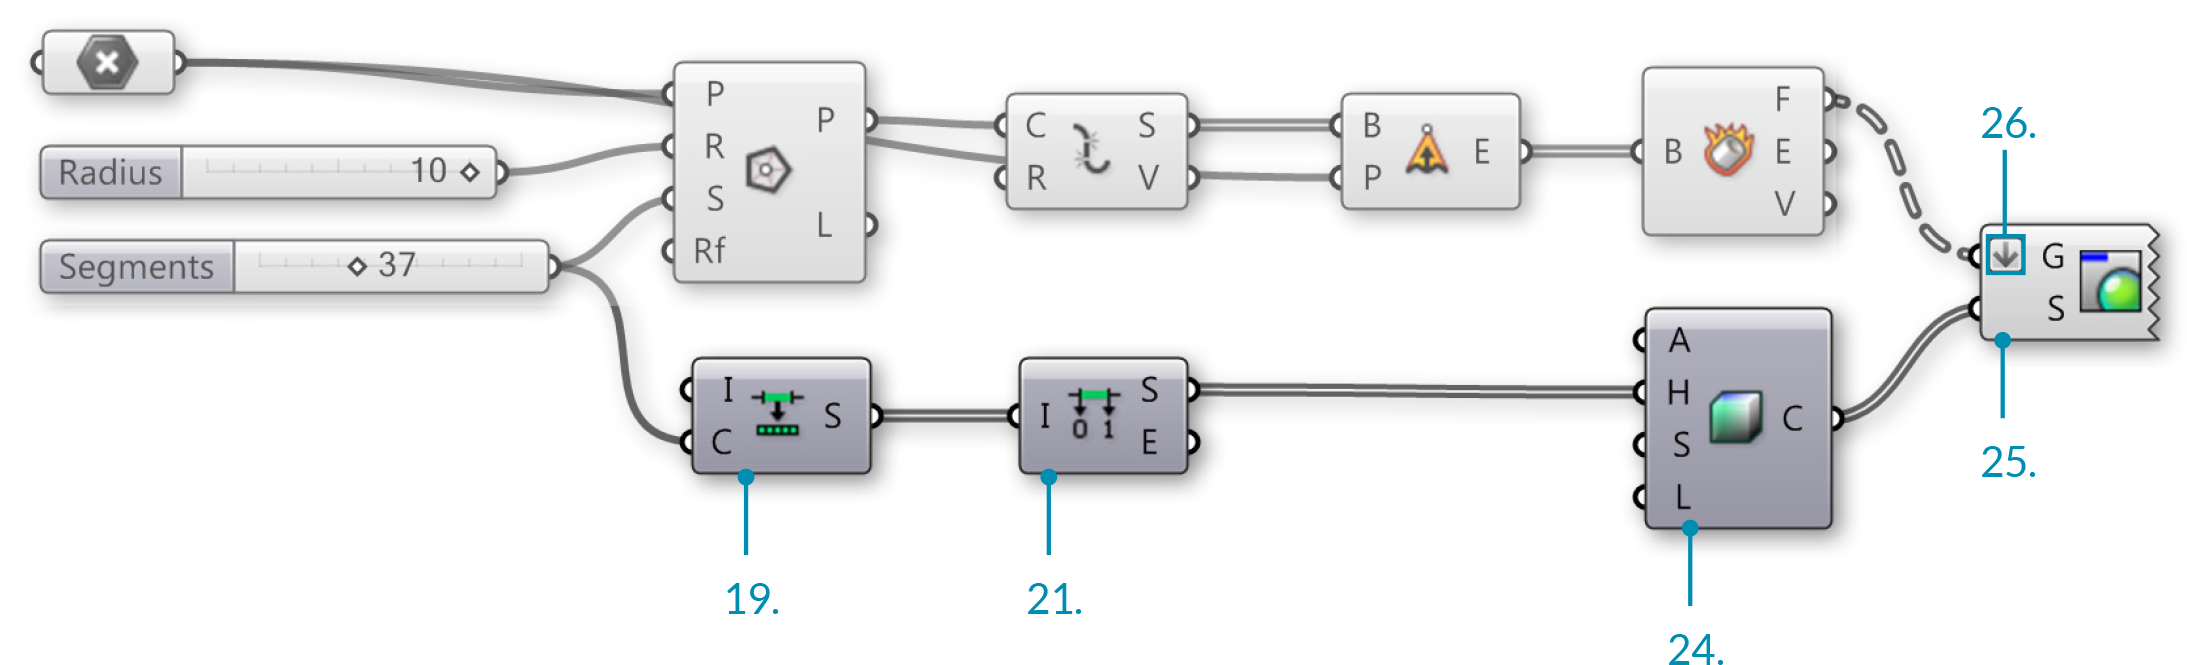

For different color effects, try connecting the Deconstruct Domain component to the saturation (S) or Luminance (L) inputs of the Colour HSL component.